Click Here to Download Flyer | Click Here to Register
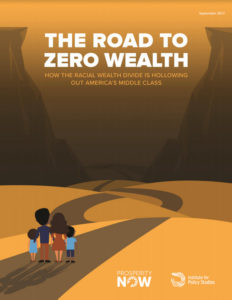
Road to Zero Wealth Report
Click Here to Download Report
 In this report, we look at the racial wealth divide at the median over the next four and eight years, as well as to 2043, when the country’s population is predicted to become majority non-white. We also look to wealth rather than income to reconsider what it means to be middle class. In finding an ever-accelerating gap, we consider what it means for the American middle class and we explore what policy interventions could reverse the trends we see today. We find that without a serious change in course, the country is heading towards a racial and economic apartheid state.
According to our new report released today, The Road to Zero Wealth, families of color are on track to see their median wealth hit zero within our lifetime, making the prospects of transferring wealth to the next generation difficult or impossible. The research featured in the new report looks at median household wealth and excludes durable goods like cars, appliances and electronics. When we remove these from our calculations, a typical Black family has just $1,700 in owned wealth—1.3% of the wealth owned by a typical White family ($132,000). And, the lack of wealth facing Black families isn’t just isolated to them; Latino families fare just barely better, with their median wealth standing at only $2,000.
In fact, if the median household wealth trends of the past 30 years continue (during which time Black and Latino families have seen their wealth decrease by a full 75% and 50%, respectively), by 2020, Black and Latino families are projected to lose an additional 18% and 12% of wealth they own today, respectively. Then, by 2024, Black and Latino households at the median are set to lose an additional 10% of their wealth. For those keeping count, this means a 20-30% decrease for the already low level of wealth held by each community today. In stark contrast, during this same timeframe, White households are projected to see their median wealth rise by five percent over where things stand today.
Click Here to Download Report
Crossroads Program Featured…
This video features the successful Crossroads program. Funded by William G. McGowan Charitable Fund, 36 clients from the Crossroads program participated in this special project.
OA-NV’s role was to provide “Your Money, Your Goals” financial education and individualized financial coaching and Getting Ahead courses for participants in 3 sessions.
Click the “play” button below to watch video…
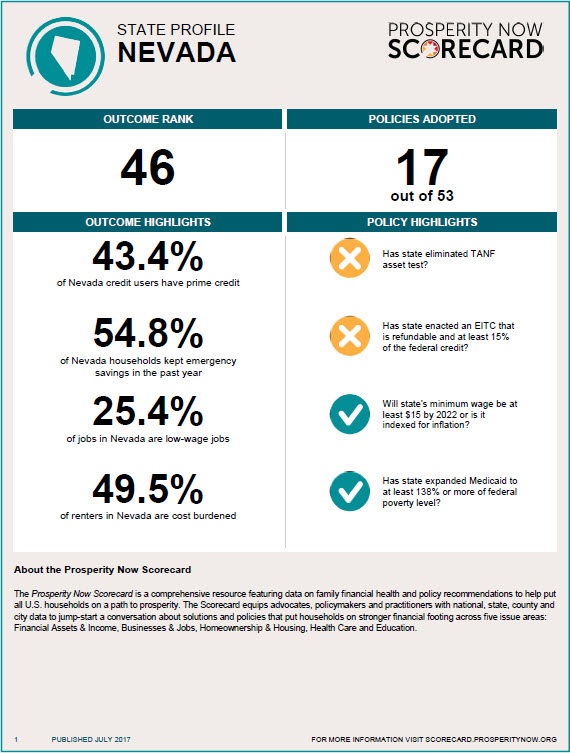
Nevada Scorecard 2017
Click Here to Download .pdf of Nevada Scorecard 2017
Click Here to Download Press Release
Click Here for Nevada Scorecard 2017
Click Here to Download Press Release
—————–
Press Release For Immediate Release
July 25, 2017
Low-Wage Jobs, Inability to Save and Build Wealth Leave Huge Numbers of Nevadans in Economic Limbo
State Ranks 46th Overall in Financial Security; 43.5% of Residents Have Virtually No Savings and One in Four Jobs Barely Cover Expenses
Washington, D.C. – Despite an unemployment rate that has ticked downward and an overall improved economy, large numbers of Nevada families continue to struggle in low-wage jobs that don’t allow them to save for a more prosperous future, according to a new report from Prosperity Now (formerly the Corporation for Enterprise Development).
Fully 43.5% of Nevada households are liquid asset poor, meaning they have so little savings that they could not live at the poverty level for just three months if they lose a job or suffer another significant income loss, according to the 2017 Prosperity Now Scorecard (formerly the Assets & Opportunity Scorecard). A new Scorecard measure also shows that while 45.2% of households in the state did not set aside any savings for emergencies in the past year, the number is higher than the national rate of 43.7%.
Even as employment has increased, the poor quality of many jobs makes it challenging for families to meet basic expenses—and nearly impossible to save enough to move up the economic ladder. A fourth (25.4%) of Nevada jobs are in in low-wage occupations, many of which do not provide workers with a reliable stream of income. The Scorecard found that 25.2% of Nevadans experienced income volatility from month to month in the past year, which studies show most often results from irregular job schedules.
Nevada households of color face even greater obstacles. They are nearly twice as likely to live below the poverty line as white households (19.2% compared to 10.7%) and much less likely to own a home or other assets that boost long-term financial stability. Less than half of households of color (42.4%) in the state own homes, compared to 61.1% of white, non-Hispanic households.
“Beyond providing a cushion to get families through emergencies, increased savings and wealth allow families to invest in their futures and gain ground for future generations,” said Andrea Levere, president of Prosperity Now. “It’s clear that far too many people are stuck in economic limbo. They may be getting by, but they aren’t getting ahead.”
Published annually, the Prosperity Now Scorecard offers the most comprehensive look available at households’ ability to save and build wealth, stay out of poverty and create a more prosperous This year’s Scorecard assesses the 50 states and District of Columbia on 60 outcome measures spanning five issue areas: Financial Assets & Income, Businesses & Jobs, Homeownership & Housing, Health Care and Education. Vermont is ranked number one in overall outcomes, while Mississippi is dead last compared with the other 49 states and the District of Columbia.
Nevada’s 46th-place outcome ranking increased slightly from last year’s 48th-place ranking. The Scorecard grades states on their progress in the five key outcome areas, and Nevada received a “D” in every area except Health Care, where it earned a “C”. The “D” received in Financial Assets & Income largely reflects the highest rate of underbanked households in the country; 27.3% of Nevada households rely on alternative methods of saving and borrowing, such as payday loans and check- cashing services. The state also earned a “D” in Homeownership & Housing, driven by the highest rate of high-cost mortgage loans statewide (16.3%). In the area of Education, a rank of 49th for both rates of early childhood education enrollment (34.3%) and high school graduation (71.3%) dragged Nevada’s score down to a “D”; however, the state also has the third-lowest rate of college graduates with debt (47%) in the country.
Additionally, the Scorecard evaluates 53 different policy measures to determine how well states are addressing the challenges facing their residents. Nevada took one step forward by ensuring that unemployment benefits are loaded onto a low-fee pre-paid card and lost ground by revoking direct lending to first-time homebuyers. The pathway to prosperity is unclear for Nevadans given that the state has passed only 4 of the 20 recommended policies in Financial Assets & Income and 1 of 9 in Education.
“While our state moved up from 48th to 46th in our outcome rank from the previous Scorecard, we clearly have more work to ensure that all families are on track toward financial prosperity. We look forward to continued partnership with our state policy makers,” Lynne Keller, Executive Director of Opportunity Alliance Nevada, Prosperity Now Community Champion.
The Prosperity Now Scorecard found that many of the challenges facing individual states are evident at the national level as well. Among the Scorecard’s key national findings:
- One in five households experienced moderate to significant income volatility from month to month during the past
- A startling 7% of Latino households and 56.7% of Black households have virtually no savings and are considered liquid asset poor, compared to 28.2% of white households.
- Disparities in net worth by race and income are the largest of any data measured by this year’s Scorecard. Households of color have 14 cents for every $1 of net worth of white households, including 7 cents for Black households and 10 cents for The lowest income quintile’s median net worth is just $3,500, compared to $137,870 for the 4thquintile and $377,200 for the top income quintile.
- The homeownership rate has not improved nationally and has been declining since 2006. The median value of homes ($194,500) is rising at a faster rate than median income ($55,775), meaning that homeownership is less affordable for those who do not already own
- More households are connected to the financial mainstream: just 7% of households are unbanked, a historic low, and consumers with prime credit scores increased by 1 percentage points over last year’s Scorecard.
“While there are positive signs in our economy and in some of the data measured by the Scorecard, it’s clear we need to do much more. Good policy at the state and federal levels can have an enormous impact on the ability of families to achieve financial stability and long-term prosperity,” said Solana Rice, Director of State and Local Policy for Prosperity Now.
To read an analysis of key findings from the 2017 Prosperity Now Scorecard, click here.
Nevada Newsmakers Interview
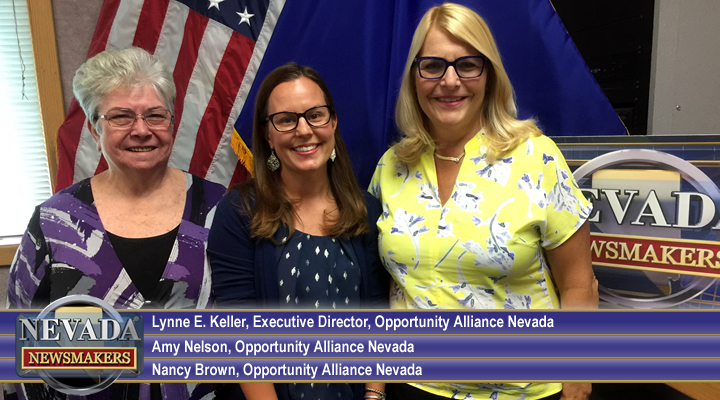
Airing on July 20, 2017, this special Nevada Newsmakers interview with Sam Shad focuses on financial security and how businesses can help their employees. It features special guests and OAN board members:
Host: Sam Shad
Guests: Lynne E. Keller, Executive Director, Opportunity Alliance Nevada
Amy Nelson, Opportunity Alliance Nevada
Nancy Brown, Opportunity Alliance Nevada
- « Previous Page
- 1
- …
- 7
- 8
- 9
- 10
- Next Page »


